
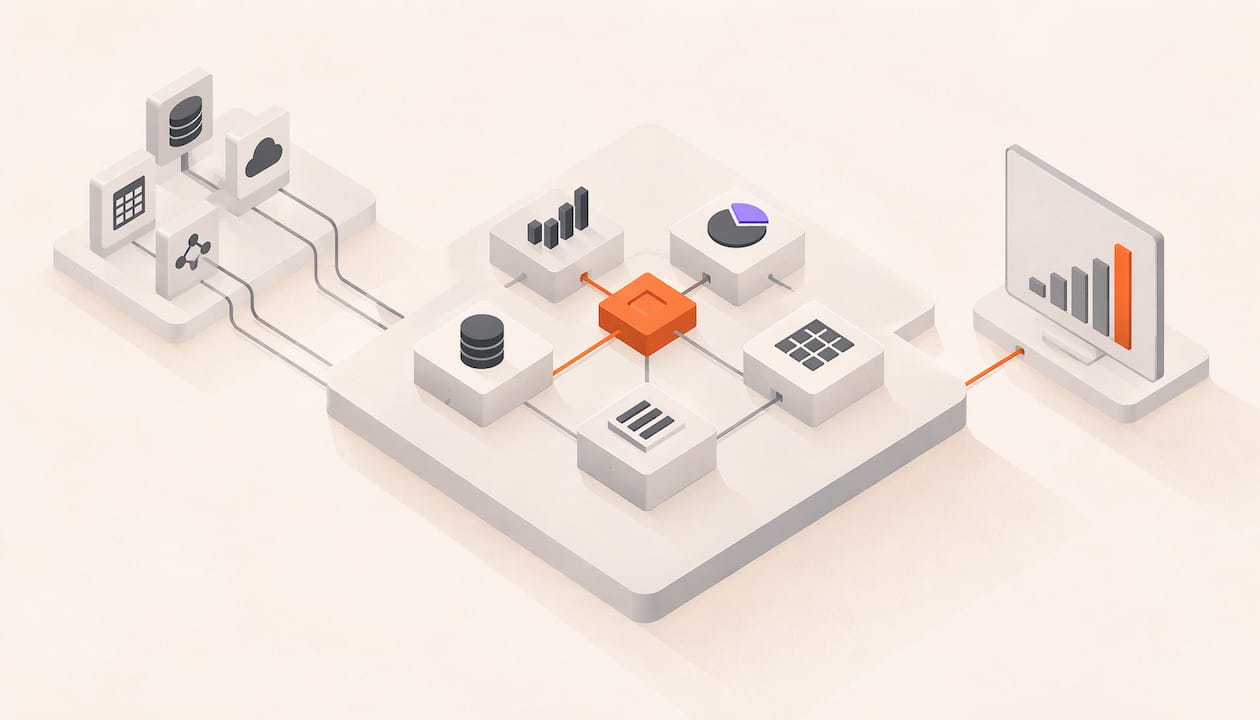
Sales analytics integration means connecting your CRM to the other tools where buyer activity lives (email, calendars, billing, support, and the documents you send), so one set of dashboards tells the same story. Start with the CRM as your record of accounts and deals. Add one new data source at a time. Then make sure each signal tells a rep what to do next. This guide shows you how, and where page-level document engagement fits in.
TL;DR
- Connect the CRM first, then add email, billing, support and document engagement, one source at a time.
- Follow a simple sequence: audit sources, map fields, set ownership and sync rules, connect, test, train.
- Keep data clean with named owners, a few quality KPIs and regular spot checks.
- Build role-specific dashboards, not one giant screen.
- Add page-level document signals so reps follow up on real attention, not just opens. WarmDoc has a free plan, so you can try it without a budget fight.
Table of Contents
- What sales analytics integration actually means
- Which data to connect first
- Why document engagement belongs in the stack
- How to integrate sales analytics step by step
- Connecting WarmDoc to the rest of your stack
- Keep integrated data accurate
- Metrics and dashboards worth building
- A worked example: the proposal that went quiet
- Our perspective
- Try it on your next proposal
- Common mistakes to avoid
- FAQ
- Sources
What sales analytics integration actually means
Sales analytics is the process of gathering sales data with technology so leaders can see progress toward goals, improve forecasting and spot new opportunities, according to Salesforce's guide. Integration is what makes that data complete. One integration guide describes it as connecting the CRM to other tools such as email, calendars, LinkedIn and billing, so teams can follow the whole customer journey instead of a basic report.
Why bother? Because disconnected tools give you disconnected answers. Marketing sees clicks. Sales sees stages. Customer success sees tickets. Nobody sees the buyer.
When the data is connected, teams can answer questions like these, which TechnologyAdvice lists for revenue intelligence:
- Which deals are most likely to close?
- Which opportunities are at risk?
- Which accounts show buying intent?
- Which reps need coaching?
- Where is pipeline slowing down?
That last group of questions is the real reason to integrate. A dashboard that only reports the past is a rear-view mirror. A connected one tells you where to call today.
Which data to connect first
Do not try to wire up everything at once. A practical setup starts with three domains, per Kaelio's cross-system guide:
- CRM data: pipeline stages, deal values, account history and sales activities.
- Billing data: subscription status, recurring revenue, churn events and invoices.
- Support data: ticket volume, resolution times, satisfaction scores and escalations.
The CRM comes first because it should be the commercial system of truth. One GTM stack blueprint says it should own accounts, contacts, opportunities and products, while not acting as the event log or the data warehouse. In other words, keep the CRM tidy and send the noisy event data somewhere else.
The five objects to keep straight
A RevOps data model guide boils B2B data down to five core objects: Person, Account, Opportunity, Activity and Subscription. Everything else, such as campaigns, tickets and invoices, attaches to one of them. The same guide argues the account is the center of gravity, because revenue comes from companies, not individuals, and that activity is the most neglected object. Every interaction should be logged with a timestamp, type, channel and a link to both a person and an account.
That last point matters for what comes next. A document view is an activity. If it is not tied to a person and an account, it is just a number.
Identity is the hard part
The same blueprint warns that a single customer view needs consistent identifiers for events, users and accounts. Otherwise product and engagement data stays trapped in isolated models. Before you connect anything, decide how you will match records: usually by email address for people and by company domain for accounts.
Why document engagement belongs in the stack
Gartner has noted that the need for collaboration among commercial functions is growing as buyer preferences evolve, and that seller-entered CRM data may no longer give enough intelligence on buyer behavior and intent. Reps type in what they remember. Buyers do much more than that.
One of the richest buyer signals is what they do with the proposals, decks and one-pagers you send. Most tools tell you only that a file was opened. That is a weak signal, and sometimes a false one, because email security scanners can open links before a human ever does.
WarmDoc is built to close that gap. It tracks engagement page by page, so you see which slides got attention. It detects when a deck is forwarded, which can point to a wider buying group. It tracks by recipient, sends real-time notifications, and scores deals hot, warm or cold. You send tracked links from your own inbox, which helps with deliverability and keeps the relationship personal.
That is exactly the kind of activity data a connected stack needs: tied to a person, stamped with a time, and meaningful enough to act on.

How to integrate sales analytics step by step
One sales analytics playbook lays out a sequence that works for most teams. Here it is, adapted to a small or mid-sized sales org.
- Audit your data sources. List every tool that touches a buyer: CRM, email, calendar, billing, support, marketing automation, document sharing. Note who owns each and what it records.
- Map your fields. Agree on names and formats. If one tool says "Lead Source" and another says "Origin," pick one. Decide what "stage," "engaged" and "qualified" mean.
- Set ownership and sync rules. Decide which system wins when two records disagree, who fixes errors, and how often data syncs (real time, hourly, daily).
- Connect with native connectors or APIs. Use built-in integrations first. For tools without one, a workflow automation layer is often enough for a small team.
- Validate with test syncs. Push a handful of records through before rollout. Check that nothing duplicates and nothing goes missing.
- Train the team to log activity. Analytics only captures what gets recorded. Show reps what is automatic and what is still manual.
If you have heavier needs, the architecture gets more layered. Nekt describes four stages: collection, storage in a warehouse, modeling that cleans fields and matches identities, and access through dashboards and alerts. Octave's warehouse guide suggests a raw layer that keeps source data as it arrives, a staging layer that standardizes and deduplicates, and an analytics layer where metrics are defined. It also describes reverse ETL, which pushes computed fields such as churn risk back into the CRM so insights show up where reps already work.
Most teams under 50 people do not need a warehouse on day one. Start with the CRM plus two or three connected sources and add layers when questions outgrow the setup.
Start with one use case
Kaelio's guide says companies with formal RevOps functions report 36% higher revenue growth, and that the fastest path is proving value with one focused use case, such as pipeline quality scoring. Pick one question. For example: "Which open proposals deserve a call today?" Build the integration that answers it, then expand.
Connecting WarmDoc to the rest of your stack
WarmDoc offers a Zapier integration, which lets you pass engagement events into the other tools your team already uses. A practical first setup looks like this:
- Upload a proposal or deck and send the tracked link from your own inbox.
- Let WarmDoc record views by page, by recipient, and any forwarding.
- Use Zapier to send the events you care about, such as a hot score or a forward, to your CRM, a team chat channel or a task tool.
- Log the event as an activity on the right person and account.
- Review the results in your weekly pipeline meeting.
The martech press describes the same goal as operationalizing insights: alerting sales teams to high-intent leads based on connected CRM and marketing data, and triggering campaigns from customer behavior. If you are building that kind of trigger logic on the marketing side, this marketing automation checklist is a handy walk-through.
For the document side of the process, our own guides go deeper:
- Page-level pipeline scoring shows how to rank deals by real attention.
- Engagement scoring in nine steps walks through building a score your team trusts.
- Proposal analytics tactics covers what to do when a proposal goes quiet.
Keep integrated data accurate
Connecting tools is the easy part. Keeping the numbers trustworthy is the long game. Gartner research found that 53% of surveyed organizations blame poor sales data quality on inaccurate and incomplete data, while only 51% have a formal data governance body, as shown in its sales analytics roadmap.
A sales analytics best-practices guide recommends treating data quality as an ongoing program, not an annual cleanup:
- Assign an owner for each data source.
- Track a few quality KPIs, such as the percent of opportunities with a next step, the percent of contacts with a role and email, and the percent of closed-lost deals with a reason.
- Run monthly spot-check audits.
- Add a data check to the weekly pipeline review.
Also stop bad data at the door. Required fields, standardized picklists and duplicate detection at entry keep errors from compounding. Aim for one record per customer.
There is a governance rule worth writing down: the CRM is the system of record, and every connected tool has explicit ownership and sync rules. Without that, you get conflicting records and reports that disagree in the board meeting.
Metrics and dashboards worth building
A connected stack can produce hundreds of charts. Resist that. A RevOps dashboard template suggests five views for weekly reviews: pipeline snapshot, forecast accuracy, conversion funnel, rep performance (activity next to outcomes) and revenue pacing.
Then split by role. The same best-practices guide advises against a mega dashboard and suggests separate views for SDRs, AEs, managers and executives, each fitting on one screen. If you want to build those views yourself, this walk-through on building a revenue dashboard in a spreadsheet is a good starting point.
Here is how the roles line up with the signals a document tracking tool adds:
| Role | Question they ask | Useful signal |
|---|---|---|
| Sales rep | Who do I call first today? | Hot, warm or cold score; pages viewed; forwards |
| Sales manager | Which reps need coaching? | Follow-up speed after engagement; team analytics |
| Marketing | Which content actually gets read? | Page-level attention across decks and one-pagers |
| Customer success | What does this client care about before the call? | Pages a recipient revisited |
| Business development | Is our proposal being passed around? | Forwarding detection |
| Product | Which materials get used? | Content usage by page |
For more on specific measures, see our guides to rep performance analytics, pipeline health metrics and sales content analytics.
A worked example: the proposal that went quiet
Picture a rep, Dana, who sent a $40,000 proposal on Monday. Her CRM shows a stage of "Proposal Sent" and nothing else. By Thursday she has no reply and no idea whether to push or wait.
With engagement data connected, Thursday looks different. The WarmDoc link shows the recipient spent most of their time on the pricing and implementation pages, and a second, unfamiliar viewer opened the deck on Wednesday. That is a forward. The deal scores hot, and a notification lands in Dana's chat channel through Zapier.
Dana does not send a generic "just checking in." She writes: "Happy to walk anyone new on your team through the implementation timeline." She gets a reply within the hour.
Nothing magical happened. A page-level signal and a forwarding alert replaced a guess. That is the payoff of integration: the data does not just sit in a dashboard, it changes what happens next.
Our perspective
Most integration projects fail in the same place. Teams connect everything, then ask reps to read more dashboards. Reps do not need more charts. They need a short list of people to contact today, and a reason for each.
That is why we built WarmDoc around credible signals. An open is cheap, and scanners can trigger it. Page-level attention and forwarding to a decision maker are much harder to fake, so they deserve a place beside the CRM stage when you decide where to spend an hour.
We also believe the tool should help the rep, not replace them. You send the link from your own inbox, in your own words. WarmDoc tells you when it warms up, and you decide what to say. Connect that signal to the systems your team already trusts, and your follow-ups get faster and more accurate.
Ty
Try it on your next proposal
You do not need a full integration project to see the value. Send your next deck through WarmDoc and watch it warm up.
Plans are published at warmdoc.io: Free at $0 per month, Pro at $19 per month per user, and Team at $39 per month per user. Annual billing on the pricing page is $190 per year per user for Pro and $390 per year per user for Team. See everything the platform does on the features page.

Start free, send one tracked link, and connect the signal to your workflow when you are ready. If you want a head start on process, our guides to turning page-level data into a content audit and the marketing to sales handoff show what to do with the first results.
Common mistakes to avoid
- Connecting before defining. If "qualified" means three things, integration just spreads the confusion faster.
- Skipping identity matching. Without consistent email and domain rules, activity lands on the wrong records or none at all.
- Logging everything. Capture activities that change decisions. A flood of low-value events buries the strong ones.
- Ignoring the rep experience. If a signal does not show up where reps work, it will not get used. Push alerts to the CRM or chat.
- No owner. Every integration needs one person who answers for it when numbers drift.
If you use sales playbooks, tie the new signals to them. Our sales playbook metrics guide explains what to track and how to review it.
FAQ
What is the first system I should integrate with my sales analytics?
Your CRM. It should hold accounts, contacts, opportunities and products, so everything else attaches to it. After that, add the source closest to buyer behavior, such as email or document engagement, because it changes follow-up decisions fastest.
Do I need a data warehouse for sales analytics integration?
Not at the start. Small and mid-sized teams can get far with a CRM and two or three connected tools, using native connectors or a workflow automation layer. A warehouse becomes useful when you need to model identities across many systems and calculate metrics in one place.
How does document tracking fit into sales analytics?
It adds buyer activity the CRM cannot capture on its own. WarmDoc shows which pages a recipient viewed, whether a deck was forwarded, and how engaged each deal is. You can then pass those signals to other tools through Zapier.
How often should I audit integrated sales data?
Monthly spot checks are a sound habit, with a quick data check in each weekly pipeline review. Pair them with entry validation, such as required fields and duplicate detection, so fewer errors get in to begin with.
Sources
- What is Sales Analytics? Key Metrics & Types (Salesforce)
- Ultimate Guide to Sales Analytics Integration
- What Is Revenue Intelligence? (TechnologyAdvice)
- How to Connect CRM, Billing, and Support Data (Kaelio)
- Blueprint for a Unified GTM Tech Stack
- How to Design a RevOps Data Model (Oscom)
- The Future of Sales Analytics (Gartner)
- What Is Sales Analytics Software? (Apollo)
- How to Build a Connected GTM Tech Stack (Nekt)
- GTM Engineer's Guide to Data Warehouses (Octave)
- Integrating Marketing BI With Your CRM & Martech Stack
- Sales Analytics: Best Practices for Insights (Saleshive)
- RevOps Dashboard Template (The RevOps Report)